
There were mixed results for stocks last week as upbeat economic data and a critical Q2 corporate report shaped the week.
The Dow Jones Industrial Average rose 0.94 percent, while the Standard & Poor’s 500 Index increased 0.24 percent. The Nasdaq Composite lagged, falling 0.92 percent. The MSCI EAFE Index, which tracks developed overseas stock markets, gained 0.35 percent.1,2
Key Economic Data
Markets began the week quiet as investors awaited Q2 earnings from Nvidia, the world’s most influential name in artificial intelligence.
The chipmaker–the second largest stock in the S&P 500 by market capitalization–dipped on the news, putting pressure on the Nasdaq and S&P 500. (The Nasdaq and S&P 500 are market-weighted averages, so larger companies have an outsized impact.)3
Nvidia is mentioned to show its influence on the overall stock market. It should not be considered a solicitation for the purchase or sale of the company.
On Thursday, an upward revision in Gross Domestic Product (GDP) data boosted markets, although stocks fell later in the day. Friday’s Personal Consumption and Expenditures (PCE) data seemed to confirm that inflation remained tame, welcome news for investors who are anticipating the Fed may adjust rates in September.4
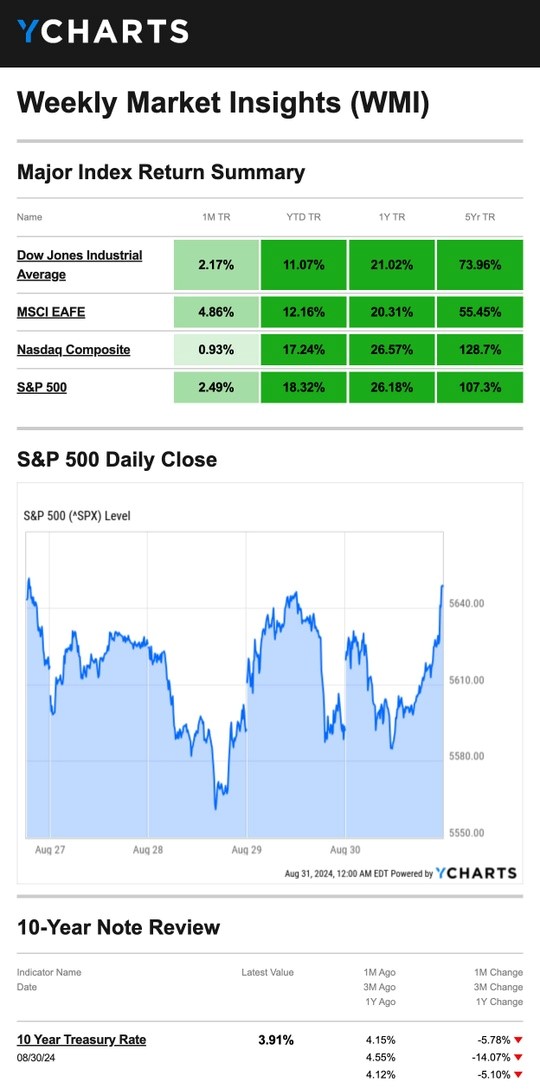
| Source: YCharts.com, August 31, 2024. Weekly performance is measured from Tuesday, August 27, to Friday, August 30. TR = total return for the index, which includes any dividends as well as any other cash distributions during the period. Treasury note yield is expressed in basis points. |
Softer Landing in Focus?
Several pieces of data helped build a narrative that the economy may be coming in for a soft landing.
Second-quarter GDP growth was revised upward, from 2.8 percent to 3.0 percent. That’s an improvement from Q1 GDP, which rose 1.4 percent. Some market watchers were concerned about the Q2 revision after pending home sales in July hit its lowest monthly level in 23 years.5
Meanwhile, the Federal Reserve’s preferred measure of inflation, the PCE Index, came in 0.2 percent higher in July–in line with expectations. Core PCE inflation, which the Fed tracks closely, edged up 0.2 percent–also in line with forecasts.6
This Week: Key Economic Data
Tuesday: ISM Manufacturing Index. Construction Spending.
Wednesday: International Trade in Goods and Services. Motor Vehicle Sales. Factory Orders.
Thursday: Jobless Claims. ADP Employment Report.
Friday: Employment Situation. Fed Official John Williams speaks.
Source: Investors Business Daily – Econoday economic calendar; August 30, 2024
The Econoday economic calendar lists upcoming U.S. economic data releases (including key economic indicators), Federal Reserve policy meetings, and speaking engagements of Federal Reserve officials. The content is developed from sources believed to be providing accurate information. The forecasts or forward-looking statements are based on assumptions and may not materialize. The forecasts also are subject to revision.
This Week: Companies Reporting Earnings
Wednesday: Hewlett Packard Enterprise Company (HPE), Dollar Tree, Inc. (DLTR)
Thursday: Broadcom Inc. (AVGO)
Source: Zacks, August 30, 2024
Companies mentioned are for informational purposes only. It should not be considered a solicitation for the purchase or sale of the securities. Investing involves risks, and investment decisions should be based on your own goals, time horizon, and tolerance for risk. The return and principal value of investments will fluctuate as market conditions change. When sold, investments may be worth more or less than their original cost. Companies may reschedule when they report earnings without notice.
1. The Wall Street Journal, August 30, 2024
2. Investing.com, August 30, 2024
3. CNBC.com, August 28, 2024
4. The Wall Street Journal, August 30, 2024
5. The Wall Street Journal, August 29, 2024
6. CNBC.com, August 30, 2024
Investing involves risks, and investment decisions should be based on your own goals, time horizon, and tolerance for risk. The return and principal value of investments will fluctuate as market conditions change. When sold, investments may be worth more or less than their original cost.
The forecasts or forward-looking statements are based on assumptions, may not materialize, and are subject to revision without notice.
The market indexes discussed are unmanaged, and generally, considered representative of their respective markets. Index performance is not indicative of the past performance of a particular investment. Indexes do not incur management fees, costs, and expenses. Individuals cannot directly invest in unmanaged indexes. Past performance does not guarantee future results.
The Dow Jones Industrial Average is an unmanaged index that is generally considered representative of large-capitalization companies on the U.S. stock market. Nasdaq Composite is an index of the common stocks and similar securities listed on the NASDAQ stock market and is considered a broad indicator of the performance of technology and growth companies. The MSCI EAFE Index was created by Morgan Stanley Capital International (MSCI) and serves as a benchmark of the performance of major international equity markets, as represented by 21 major MSCI indexes from Europe, Australia, and Southeast Asia. The S&P 500 Composite Index is an unmanaged group of securities that are considered to be representative of the stock market in general.
U.S. Treasury Notes are guaranteed by the federal government as to the timely payment of principal and interest. However, if you sell a Treasury Note prior to maturity, it may be worth more or less than the original price paid. Fixed income investments are subject to various risks including changes in interest rates, credit quality, inflation risk, market valuations, prepayments, corporate events, tax ramifications and other factors.
International investments carry additional risks, which include differences in financial reporting standards, currency exchange rates, political risks unique to a specific country, foreign taxes and regulations, and the potential for illiquid markets. These factors may result in greater share price volatility.
Please consult your financial professional for additional information.
This content is developed from sources believed to be providing accurate information. The information in this material is not intended as tax or legal advice. Please consult legal or tax professionals for specific information regarding your individual situation. This material was developed and produced by FMG Suite to provide information on a topic that may be of interest. FMG is not affiliated with the named representative, financial professional, Registered Investment Advisor, Broker-Dealer, nor state- or SEC-registered investment advisory firm. The opinions expressed and material provided are for general information, and they should not be considered a solicitation for the purchase or sale of any security.
Copyright 2024 FMG Suite.
