
Stocks ended last week with modest losses, masking a volatile five-day trading period that saw investors embrace recession concerns and then dismiss the slow-down talk as speculation as the week progressed.
The Dow Jones Industrial Average slipped 0.60 percent, while the Standard & Poor’s 500 Index ended flat (-0.04 percent). The Nasdaq Composite dipped 0.18 percent. The MSCI EAFE Index, which tracks developed overseas stock markets, fell 1.21 percent.1,2
Stocks Stage Comeback
Monday was the worst day for the S&P 500 and the Dow in nearly two years. As recession talk grew louder, investors took a “risk off” position.
On Monday, the Japanese market had its worst drop since 1987 as market participants unwound positions from a popular trading strategy called a “carry trade” amid a global sell-off in stock prices.3
But on Thursday, initial jobless claims fell less than expected—a positive sign for the labor markets— which quieted some of the recession talk. Also, as the week progressed, there was growing speculation that the July jobs report was more of an outlier than a lead indicator of a pending recession.
By Friday’s close, all three major averages had regained most of the week’s losses.4
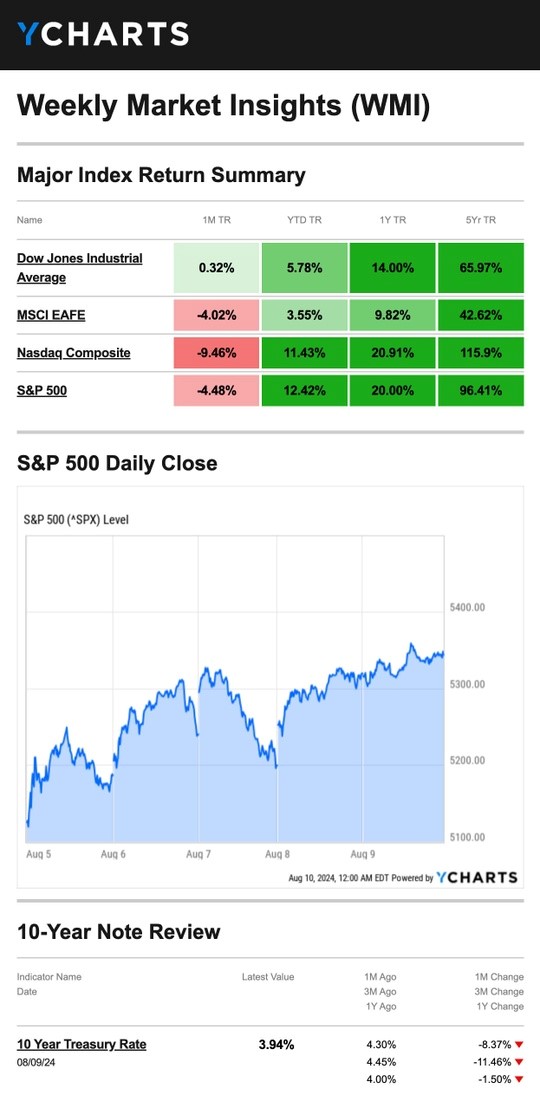
| Source: YCharts.com, August 10, 2024. Weekly performance is measured from Monday, August 5, to Friday, August 9. TR = total return for the index, which includes any dividends as well as any other cash distributions during the period. Treasury note yield is expressed in basis points. |
Mortgage Update
Last Thursday, the average rate on a 30-year fixed mortgage dropped to 6.47 percent—a 15-month low. Many home buyers welcomed the news, and it appeared to help support Thursday’s rally.5
But the announcement left some wondering whether rates would continue to trend lower. Mortgage rates are tied to the interest rates set by the Federal Reserve. Some speculated the drop was due to market participants anticipating the Fed would adjust rates in September, which remains anything but certain.6
This Week: Key Economic Data
Tuesday: Producer Price Index (PPI). Fed Official Raphael Bostic speaks.
Wednesday: Consumer Price Index (CPI). EIA Petroleum Status Report.
Thursday: Jobless Claims. Retail Sales. Industrial Production. Business Inventories. Fed Officials Alberto Musalem and Patrick Harker speak.
Friday: Housing Starts and Permits. Consumer Sentiment. Fed Official Austan Goolsbee speaks.
Source: Investors Business Daily – Econoday economic calendar; August 8, 2024
The Econoday economic calendar lists upcoming U.S. economic data releases (including key economic indicators), Federal Reserve policy meetings, and speaking engagements of Federal Reserve officials. The content is developed from sources believed to be providing accurate information. The forecasts or forward-looking statements are based on assumptions and may not materialize. The forecasts also are subject to revision.
This Week: Companies Reporting Earnings
Tuesday: The Home Depot, Inc. (HD)
Wednesday: Cisco Systems, Inc. (CSCO)
Thursday: Walmart Inc. (WMT), Applied Materials, Inc. (AMAT), Deere & Company (DE)
Source: Zacks, August 8, 2024
Companies mentioned are for informational purposes only. It should not be considered a solicitation for the purchase or sale of the securities. Investing involves risks, and investment decisions should be based on your own goals, time horizon, and tolerance for risk. The return and principal value of investments will fluctuate as market conditions change. When sold, investments may be worth more or less than their original cost. Companies may reschedule when they report earnings without notice.
1. The Wall Street Journal, August 9, 2024
2. Investing.com, August 9, 2024
3. CNBC.com, August 5, 2024
4. The Wall Street Journal, August 8, 2024
5. The Wall Street Journal, August 8, 2024
6. The Wall Street Journal, August 9, 2024
Investing involves risks, and investment decisions should be based on your own goals, time horizon, and tolerance for risk. The return and principal value of investments will fluctuate as market conditions change. When sold, investments may be worth more or less than their original cost.
The forecasts or forward-looking statements are based on assumptions, may not materialize, and are subject to revision without notice.
The market indexes discussed are unmanaged, and generally, considered representative of their respective markets. Index performance is not indicative of the past performance of a particular investment. Indexes do not incur management fees, costs, and expenses. Individuals cannot directly invest in unmanaged indexes. Past performance does not guarantee future results.
The Dow Jones Industrial Average is an unmanaged index that is generally considered representative of large-capitalization companies on the U.S. stock market. Nasdaq Composite is an index of the common stocks and similar securities listed on the NASDAQ stock market and is considered a broad indicator of the performance of technology and growth companies. The MSCI EAFE Index was created by Morgan Stanley Capital International (MSCI) and serves as a benchmark of the performance of major international equity markets, as represented by 21 major MSCI indexes from Europe, Australia, and Southeast Asia. The S&P 500 Composite Index is an unmanaged group of securities that are considered to be representative of the stock market in general.
U.S. Treasury Notes are guaranteed by the federal government as to the timely payment of principal and interest. However, if you sell a Treasury Note prior to maturity, it may be worth more or less than the original price paid. Fixed income investments are subject to various risks including changes in interest rates, credit quality, inflation risk, market valuations, prepayments, corporate events, tax ramifications and other factors.
International investments carry additional risks, which include differences in financial reporting standards, currency exchange rates, political risks unique to a specific country, foreign taxes and regulations, and the potential for illiquid markets. These factors may result in greater share price volatility.
Please consult your financial professional for additional information.
This content is developed from sources believed to be providing accurate information. The information in this material is not intended as tax or legal advice. Please consult legal or tax professionals for specific information regarding your individual situation. This material was developed and produced by FMG Suite to provide information on a topic that may be of interest. FMG is not affiliated with the named representative, financial professional, Registered Investment Advisor, Broker-Dealer, nor state- or SEC-registered investment advisory firm. The opinions expressed and material provided are for general information, and they should not be considered a solicitation for the purchase or sale of any security.
Copyright 2024 FMG Suite.
